 SheetWorkflow Guide
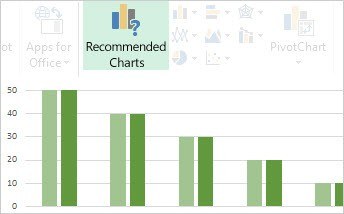
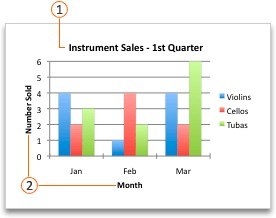
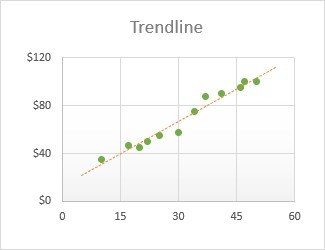
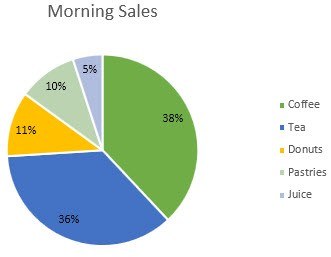
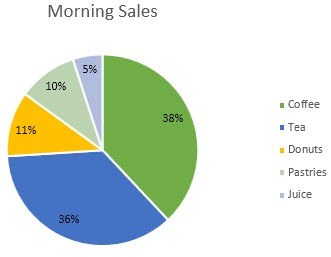
Microsoft describes chart creation as a sequence that starts with suitable data, chooses a chart, and then refines the details. Recommended charts can help establish a starting point, while titles, labels, and layout controls clarify the result. The visual can later be copied into another Office document.
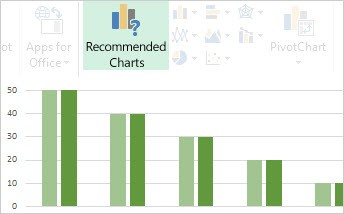
Review what the chart should communicate before adding presentation details. Check the included series and their labels, then inspect the final size and destination. A linked chart and a static copy serve different update needs, so choose the transfer method deliberately when placing the visual in a report.



Comments (0)