 SheetWorkflow Guide

Keep gridlines only when they serve the comparison
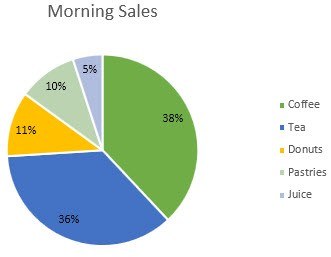
Default chart elements are not automatically useful in every report. The source describes reducing visual noise by removing unnecessary gridlines from a presentation chart, while acknowledging that light gridlines can help when precise comparisons matter. The choice depends on how the graph will be read. Simplifying the background should make the values easier to follow, not remove references that the audience genuinely needs.
Use a restrained visual hierarchy
The article also recommends a limited, purposeful color palette rather than allowing every series to compete equally for attention. Review spacing and other default choices with the same question: does this element explain the data or distract from it? Once a useful design is established, it can be saved as a reusable template. Recheck each new chart's labels and message rather than assuming a consistent style alone guarantees clarity.




Comments (0)